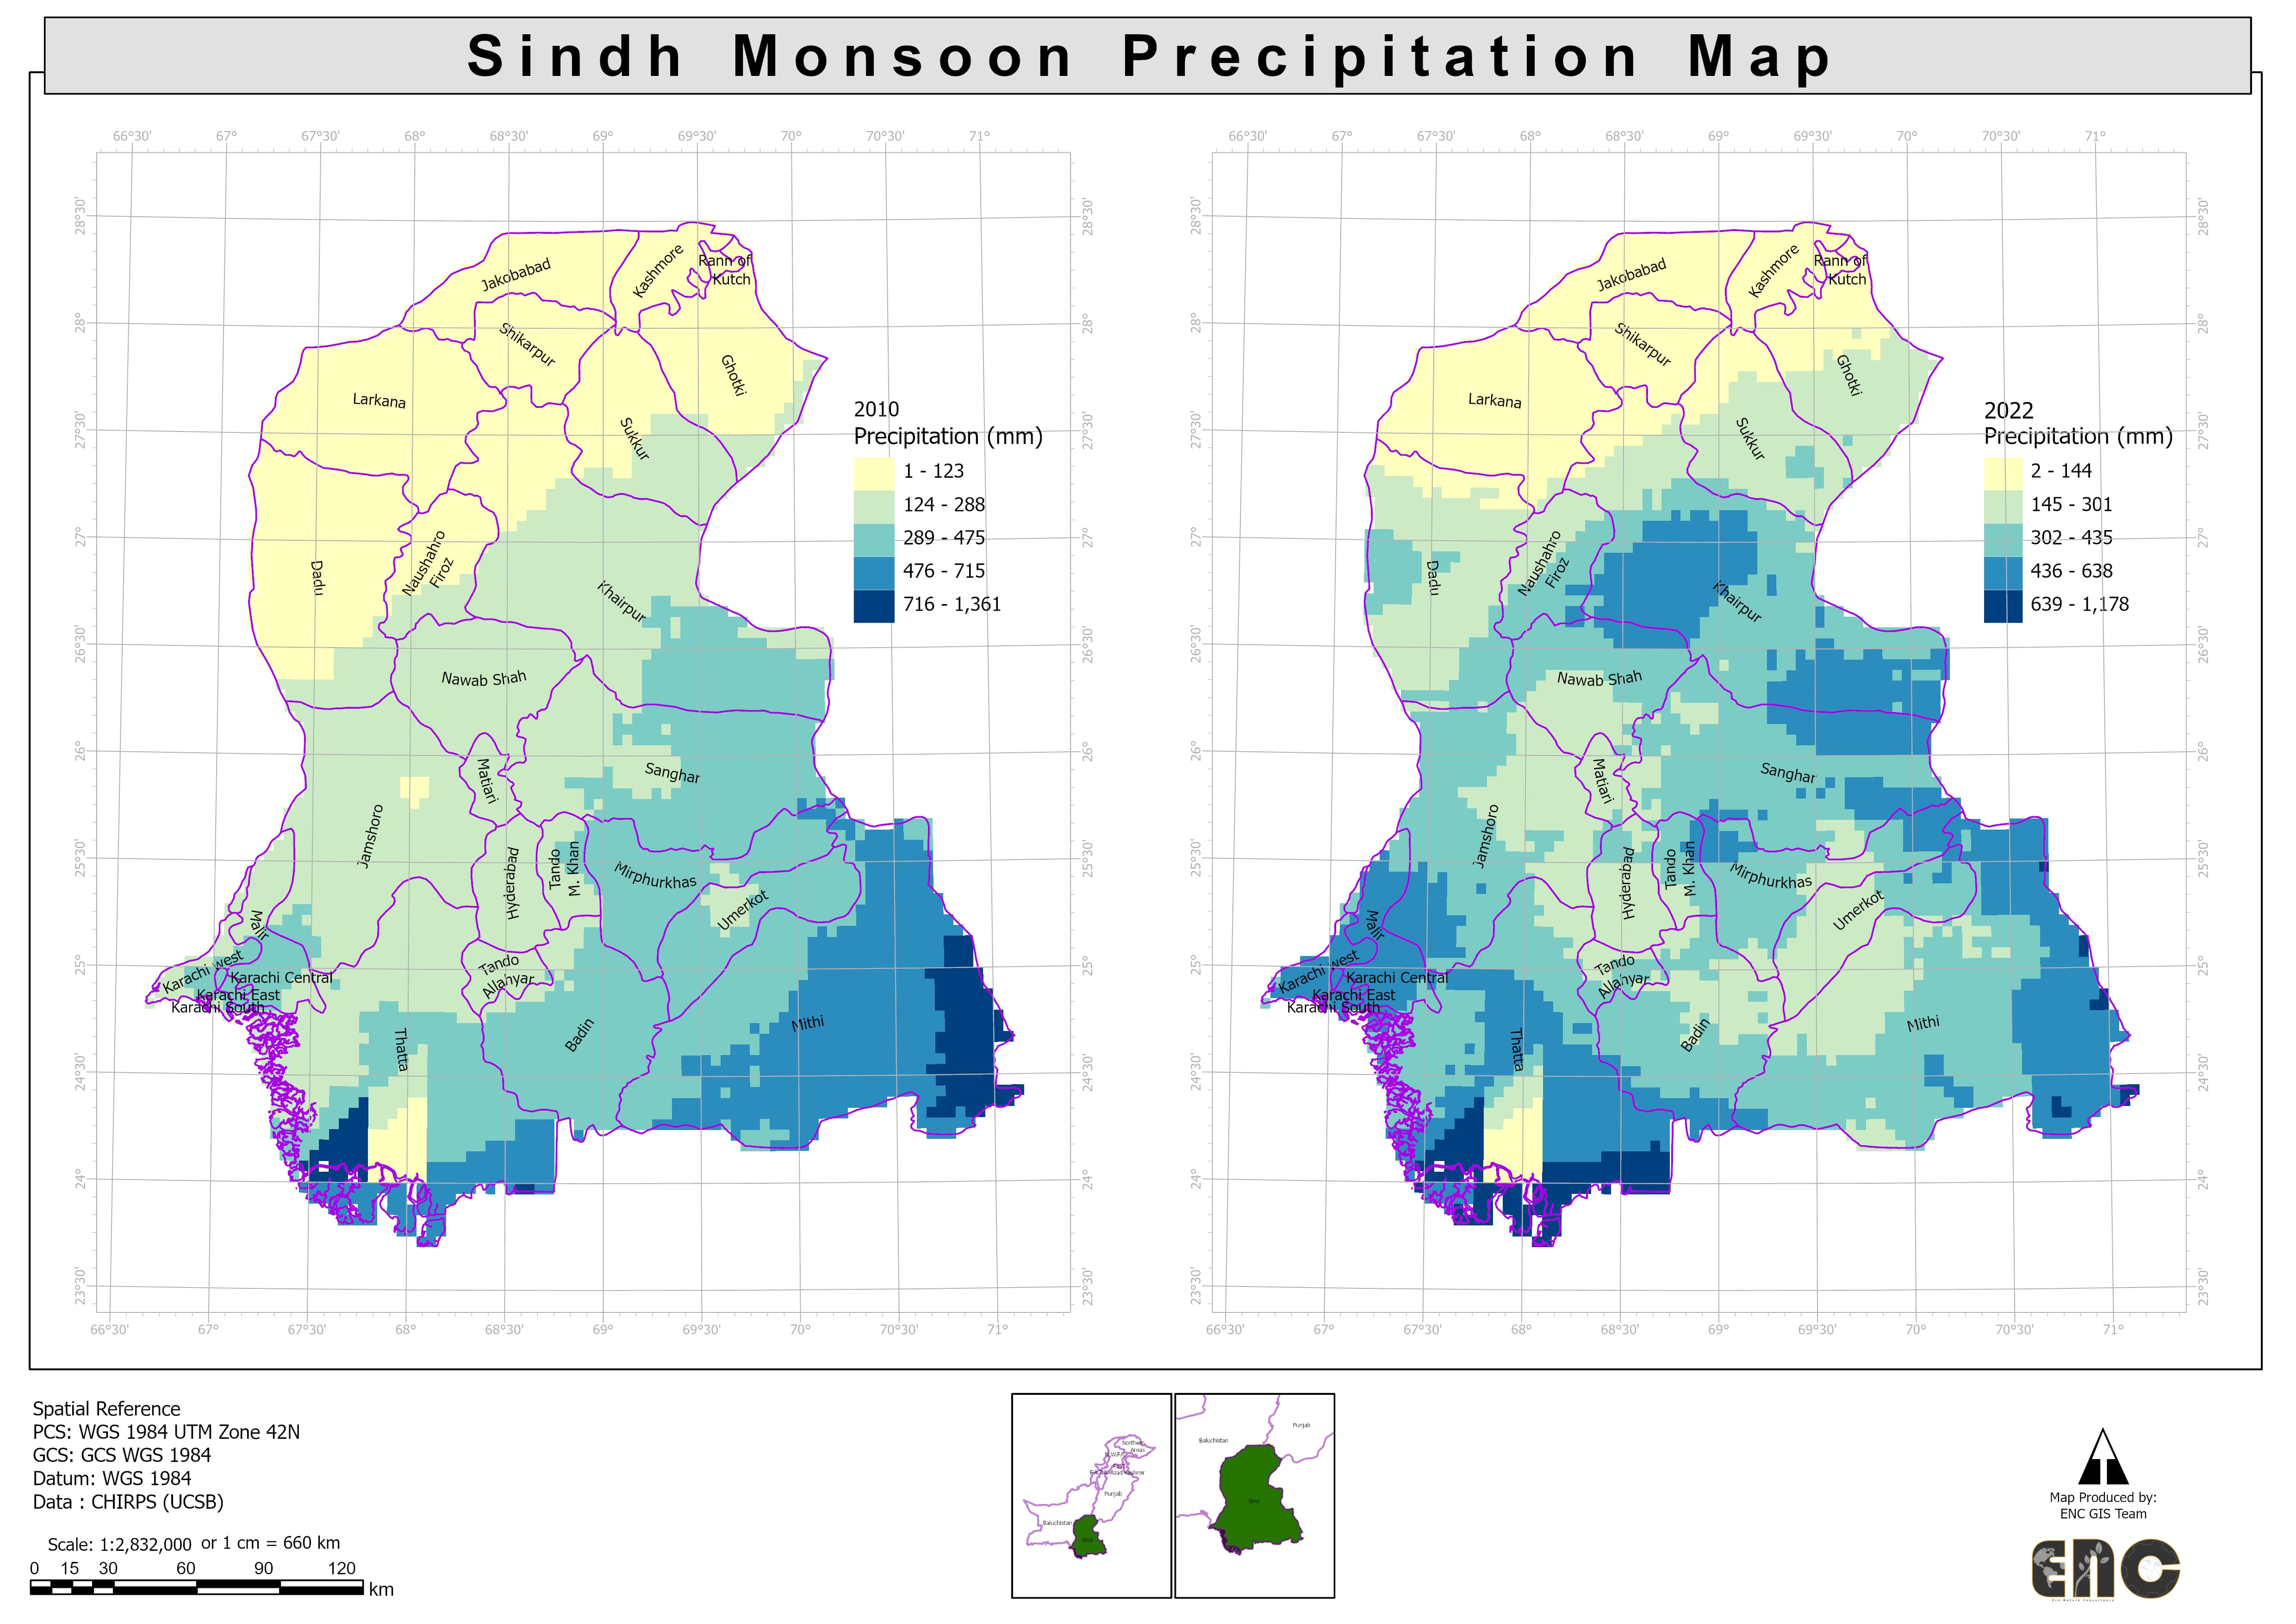
Sindh Monsoon Precipitation Mapping: 2010 vs. 2022
This spatial analysis map compares total monsoon precipitation across Sindh province during two of Pakistan's most historic flood years: 2010 and 2022. Developed by our GIS team using CHIRPS (Climate Hazards Group InfraRed Precipitation with Station) satellite data, the map highlights significant shifts in rainfall intensity and geographic distribution.
Key Insights:
2010 Monsoon: Heavy rainfall was primarily concentrated in the southeastern and coastal districts of Sindh (such as Tharparkar and Badin), with northern and central districts receiving relatively lower precipitation.
2022 Monsoon: The rainfall pattern changed dramatically, showing vastly increased intensity and broader coverage. Central and northern districts including Khairpur, Naushahro Feroze, and parts of Larkana experienced extreme, unprecedented precipitation levels exceeding 1,000 mm in several areas.
This comparative mapping underscores the changing dynamics of extreme weather events in the region, providing vital baseline data for climate resilience, disaster risk management, and regional adaptation planning.